In this article I’ll show why a CTO should have a scientific approach to technological decision. Arguably, this means that companies should consider science as a potentially good background for CTO candidates.

No CTO was Ever Fired for Buying Oracle
This is an old saying, and I suspect that it’s not true anymore. The idea was: Oracle is big, Oracle is rich, Oracle makes C levels feel safe. A CTO might be fired for choosing to rely on some exotic technology or small vendor, or for opting for an open source technology. When something won’t work and will cause a disaster, the CTO is responsible. A lot of pressure is on the CTO…
Maybe many companies in the financial sector still apply this simplistic reasoning. Medium-sized companies and startups just can’t afford it. Too expensive. And that mindset is exactly what made Birmingham Council bankrupt: they trusted Oracle, they paid the price (which was bigger than their bank account).
Replace Oracle with the company you hate the most, and the reasoning will still work (except that not all of them made Birmingham bankrupt, fortunately).
No CTO was Ever Fired for being a Trendy Person
Let’s modernise the above saying. The point is not paying Oracle or one of its impressive competitors. The point is following industry trends. Of course they exist for a reason, right? Following them should reduce the risks (more on this later).
We still have three go-to giants in the cloud. You know who they are. But when it comes to databases, web servers, programming languages, and many other technologies, you don’t necessarily choose a proprietary one. Usually, you go for the most common open source choices.
And you, as a CTO, feel safe! I mean: can you be fired to choosing Django and PostgreSQL? Or Nodejs and MongoDB? Come on. It matters very little if the stack you’ve chosen is not so efficient for your particular use case: if it’s known to be cool, your decision won’t be objected by anyone who has the power to kick you off.
It might be objected by your best senior members of your team, though. But it’s ok not to listen them. Most CTOs don’t, and no one fires them for this.
But Me Some But, Damn It!
Sorry for describing the reality as is. It doesn’t mean that I approve it. And if you’re reading, you probably need some but now, to avoid falling into depression. You want to be a decent CTO, not just one that works for a successful company and doesn’t get fired, right? (Right?)
Brilliant, here’s my but: you can listen to your team, experiment their ideas, adopt the ones that prove good.
The Scientific Approach
Do you know the four steps of the scientific method? Applied to IT stack decisions, it would be the following:
- Read the news, listen to your team, research
By reading the news, you will learn about new technologies that you might use. Understand what they are, what they can do for you, what their limitations are. Ask your team for their opinions. Give them the time to make some research. - Hypothesis
The scientific method requires hypotheses. A hypothesis is a logical statement, that follow an if-then pattern. If we put Varnish in front of read-only APIs, the application’s latency will decrease. You do this simply by learning about a technology or a methodology, and thinking about the concrete problems it might solve for you. - Prediction
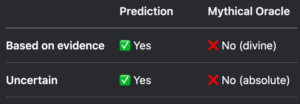
In science, hypotheses lead to predictions, which are expectations that can be falsified to disprove a theory. In your case, they are a hypothesis with an action plan and a goal. For example: if we put Varnish in front of these specific API routes, we expect a 30% performance increase. A prediction implies a decision: if you only get a 25% speed up, Varnish is good but in your case it’s not worth the implementation effort. - Test
Ask your team to make a precise plan: how to run the tests, how to measure the results. You can’t just test in production, obviously. But you can test in conditions that are similar to production, with a similar level of concurrency, with similar sequences of events. - Analyse and decide
Now you should have clear results. Did you reach your goal? If so, go ahead and make a plan to implement the new technology. If not, you might give up or you might change your prediction. Maybe Varnish could have been implemented in a more optimal way, or maybe you didn’t use it for the right case.
The above example is about a technology that can be added to your IT stack to improve the system performance. But you can apply it to most decisions that a CTO can make. You learnt about a methodology that should speed up development? Test it with one team for one month, define clear metrics, then evaluate. You learnt about a tool that should reduce the number of bugs? Try it with some new code development. Make sure to choose a sensible metric, like the number of customer support tickets that involve that specific component.
Communication
You work in a company. Don’t be an island. Don’t just hope that your boss leave you free to do your job and doesn’t care (or realise) that your choices aren’t the most common. Instead, show what you’re doing with proud!
As we discussed, you need numbers to experiment. Good luck finding those numbers alone, or asking your team to provide them. In my opinion, you’d better ask the data team to setup measurements and a dashboard. See the dashboard as a very understandable way to shoe the complicate benefits you obtain by doing complicated stuff.
Don’t ask your colleague to leave you free to do your job. Ask your colleagues to follow your example. Offer your help. Offer your guidance, your learnings, your tools. They can experiment new ways of selling, new tools for automating marketing actions, or whatever might improve their job by doing something that is not necessarily the standard way to do stuff. They can see if it works by looking at the numbers. And if it works, they can adopt new methodologies and prove their success. And you’ll be the one who drove a big change!
Costs versus Benefits
At the beginning of this article, I’ve been (intentionally) a bit unfair. Often, CTOs don’t follow industry habits just to avoid getting fired (even though you can’t deny that it’s a strong drive). There are more reasons. For example:
- Finding experts of a widely use technology is easier (faster recruitment).
- Those experts tend to be less expensive (cost reduction).
- People are easier to replace when they follow standard methodologies with standard tools (smoother onboarding).
- You can find a lot of read-made open source tools for well-established technologies and methodologies (big ecosystem).
Sometimes these drawbacks can be transformed into an opportunity. Do you use Haskell? There aren’t many Haskell developers, so expect your new hires to learn it, rather than already knowing it. But developers might see Haskell as an exotic piece of archeology, right? Then make it appealing by explaining the reasons why you use it. Explain that, for your use case, it produces better, more readable code. Explain that functional programming forces you to think in the right way to solve the types of problems you deal with. Open source your framework and tools. Encourage your team to participate events, and propose their talks on how your unusual technology choices produce better results, in elegant ways.
All that being said, a CTO should consider other aspects, too. Consider things like your application latency, data throughput, code reliability, cost of development and maintenance… all these things might benefit from using technologies and methodologies that better fit your case, even if they’re not industry standards.
IMAGE CREDIT: Gemini 2.5 Flash Image